Editors reprinting articles
from this JOURNAL are requested to credit the
author, the JOURNAL OF THE ASSOCIATION, and the Society
before which such articles were read.
ASSOCIATION
OF
ENGINEERING SOCIETIES.
Organized 1881.
ASSOCIATION
OF
ENGINEERING SOCIETIES.
Organized 1881.
VOL. Ll.
OCTOBER, 1913.
No. 4.
This Association is not responsible for
the subject-matter contributed by any Society
or for the statements or opinions of members of the
Societies.
A LAND MAP OF THE WORLD ON A NEW PROJECTION.
By B. J. S. CAHILL, A.I.A., F.R.G.S.
[Read before the Technical Society of the
Pacific Coast, October I I, 1912, and discussed
before the Association of Scientific Societies.]
ON a previous occasion, when I enjoyed the privilege
of addressing you, I spoke of the plans I made
for San Francisco's Civic Center. It is now over
thirteen years since I made the first plan to improve
the city of San Francisco. I began the movement single-handed
and was looked upon at the time as an impossible dreamer. Nevertheless,
the actual plan which I drew in 1904, my second scheme, the
one I described to this Society, has now been adopted almost
exactly as I planned it eight years ago. With some modifications
rendered possible, though not in my opinion desirable, by reason
of the destruction of the City Hall, this plan is now being actually
carried out at a cost of some ten millions of dollars. This fact
is mentioned for two reasons bearing on the subject in hand.. In the
first place, the initial failures following any great endeavor — and
they are inevitable — have the effect on one's energies that obtains
in the world of physics. If one's efforts are baffled and suppressed
in one direction, they seek vent in another. From the failure of
my Civic-Center plans in 1905 dates the beginning of my activities
on the new map projection. Then, secondly, if one's ideas
finally triumph and one lives to see victory follow defeat, the result
is a moral strengthening of purpose and an access of new courage
and confidence in fresh fields of endeavor. I am therefore emboldened
to say to you, not only with confidence
153
154 ASSOCIATION OF ENGINEERING SOCIETIES.
but with conviction, that this new projection which
I shall show you to-night will, before many years, be in use in the text-books,
atlases, maps and encyclopedias of the world. Since I have spoken of city
planning, let me quote to you a very notable utterance of the late Daniel
H. Burnham, the architect, in his concluding remarks before the London Town
Planning Conference of 1910. He said, "Remember that a noble logical diagram
once recorded will never die; long after we are gone it will be a living
thing, asserting itself with ever-growing insistency, and, above all, remember
that the greatest and noblest that man can do is yet to come, and that this
will ever be so, else is evolution a myth."
In presenting my subject I shall first point out the inadequacy of the projections now in use; I shall then explain the principles of the new projection and conclude by showing some of the uses to which it can be put.
In presenting my subject I shall first point out the inadequacy of the projections now in use; I shall then explain the principles of the new projection and conclude by showing some of the uses to which it can be put.
I.
At the very outset I want to state that when speaking
of projections I have in mind, of course, projections
of the whole world, and my criticism of existing
maps is wholly confined to world maps. Regarding regional
maps, marine charts, geodetic and topographical surveys, it
is only necessary to say that this, the main part of the science
of cartography, has been brought to the highest pitch of perfection
by the joint labors of many of the world's greatest mathematicians.
Needless to say, I make no claims to improvements here. But the
fact that map making has been almost wholly in the hands of theoretical
scientists has resulted in certain abuses which I think engineers
can very well appreciate. A bridge designed wholly from the
mathematician's standpoint may not be practical or desirable from
the viewpoint of those who intend to use the bridge by going under
it on water, or over it on wheels. Just exactly why ultra-mathematical
world maps are unsatisfactory, we shall see further on in detail.
The earliest projections used by the Greeks concerned themselves with a hemisphere only. A point of light is conceived at the center, casting a shadow through the surface of the hemisphere on to a tangent plane. This is the gnomonic projection, invented by Thales. (See Fig. 3, 4, 9 and 15.) When this point of light is moved away into the plane of the completed sphere, — that is to say, twice as far from the point of tangency
The earliest projections used by the Greeks concerned themselves with a hemisphere only. A point of light is conceived at the center, casting a shadow through the surface of the hemisphere on to a tangent plane. This is the gnomonic projection, invented by Thales. (See Fig. 3, 4, 9 and 15.) When this point of light is moved away into the plane of the completed sphere, — that is to say, twice as far from the point of tangency
LAND MAP OF WORLD ON NEW PROJECTION.
155
as the gnomonic, — the resulting projection
is called the stereographic. (See Fig. 1 and 2.)
A third method moves the point of light to an infinite distance, so that lines of projection are all parallel. This is the projection generally used by architectural, engineering and mechanical draftsmen, (See Fig. 5, 6 and 11.) Hipparchus invented both of these. A fourth projection of this class was proposed by La Hire in 1701 and perfected by Lambert, the greatest, perhaps, of all modern projectionists, The point of light is here supposed to be at such a distance from the surface of the completed sphere that the radius of the shadowed disk is exactly the same length as the arc of a quadrant. (This distance is √ ½ times radius beyond the surface of the sphere,) (See Fig. 7, 13, 23, 24 and 25,)
In these projections, excepting the first mentioned, the whole world must be shown in two disks, Fig. 1, 2, 5, 6 and 7 show how different the results are. They are all drawn to the same scale, yet the half of the world shown looks different in each,
The gnomonic projection cannot show the whole world on two disks because they would have to be infinite in size, So, instead of 180 degrees of arc, we show only 90 degrees; the tangent planes are made square and six in number. In this projection the world becomes a cube, Thales, therefore, who lived several centuries before Christ, was the first "cubist." (See Fig. 3, 4, 9 and 15.)
In the next type of projection the shadow is thrown on to a tangent cylinder or a tangent cone. The cylinder, or cone, is then developed or laid flat. (See Fig. 11, 12, 13, 14, 17, 19 and 49.)
The point of light may be, as in the other projections mentioned, central, or at an infinite distance, or at varying points between.
In all these methods the plane of projection can be conceived as a secant, as well as a tangent plane. In each case also the plane of projection may be parallel to the equator or the pole or any horizon between.
It has been noted that the orthographic and stereographic projections can only show a hemisphere at a time. The gnomonic must show less, preferably a third, and the globular may show more, conveniently a third, The cylindrical method shows the whole world on one rectangular plane, with parallel meridians, The conical method may also show the whole world
156 ASSOCIATION OF ENGINEERING SOCIETIES.
on a fan-shaped plane with meridians converging
to one pole extended. This method may also be used
on one hemisphere at a time, showing the northern and
southern hemispheres, for example, as two fan-shaped planes
of more or less obtuse or acute convergence, according
to the high or low latitude of actual or mean tangency.
All these projections are in reality skiagraphic, made by casting shadows, and whether direct on disks, or by development on cylinder and cone, they all have one fault in common. Their ultimate form or boundary bears no relation to the surface of the sphere or part of the sphere they represent.
I wish to call attention to the curious relation between the forms generated in these projections; the sphere, whose surface is to be represented, and the cube, the cone and the cylinder. The three classic projections are based on these forms. The gnomonic projects the sphere on to the six sides of a circumscribed cube; the orthographic projects the sphere on to the two ends of a circumscribed cylinder; the stereographic projects the sphere on to the tangent bases of two inscribed intersecting right cones.
Now, curiously enough, in a complementary and reciprocal sort of way, we have a projection where the side of a cylinder carries the projected outlines of the earth, that is, Mercator's, and another where the side of a cone carries the outlines of the earth.
In other words, the modern conic projection is a sort of reciprocal of the classic stereographic, and the modern Mercator map is a reciprocal of the classic orthographic. In the first case, the: base of cone and cylinder carries the shadowed imprint of the sphere's surface, the sides being blank. In the second case, the side of the cone and cylinder carries the shadowed imprint of the sphere's surface, the bases being blank. (See Fig. 9, 11, 12, 13 and 14.)
The stereographic and globular very much stretch the periphery of the map so that the edges are exaggerated, while
All these projections are in reality skiagraphic, made by casting shadows, and whether direct on disks, or by development on cylinder and cone, they all have one fault in common. Their ultimate form or boundary bears no relation to the surface of the sphere or part of the sphere they represent.
I wish to call attention to the curious relation between the forms generated in these projections; the sphere, whose surface is to be represented, and the cube, the cone and the cylinder. The three classic projections are based on these forms. The gnomonic projects the sphere on to the six sides of a circumscribed cube; the orthographic projects the sphere on to the two ends of a circumscribed cylinder; the stereographic projects the sphere on to the tangent bases of two inscribed intersecting right cones.
Now, curiously enough, in a complementary and reciprocal sort of way, we have a projection where the side of a cylinder carries the projected outlines of the earth, that is, Mercator's, and another where the side of a cone carries the outlines of the earth.
In other words, the modern conic projection is a sort of reciprocal of the classic stereographic, and the modern Mercator map is a reciprocal of the classic orthographic. In the first case, the: base of cone and cylinder carries the shadowed imprint of the sphere's surface, the sides being blank. In the second case, the side of the cone and cylinder carries the shadowed imprint of the sphere's surface, the bases being blank. (See Fig. 9, 11, 12, 13 and 14.)
But the world is neither cubical, cylindrical nor
conical, and none of these really artificial methods, although called natural,
are of much all-round value to the geographer, although as practical diagrams
for mariners the gnomonic is invaluable for purposes of steam navigation,
and Mercator's for steering a course by log
and compass. Both methods used on large areas show
enormous exaggeration, Mercator at the poles and the
gnomonic at the edges. (See Fig. 15, 17, 19 and 49.)
The stereographic and globular very much stretch the periphery of the map so that the edges are exaggerated, while
LAND MAP OF WORLD ON NEW PROJECTION.
157
the orthographic preserves the peripheral distances,
but distorts by overcrowding, Moreover, only two
of these methods show the world in one continuous map.
Attention is called to the vital question of scale in these illustrations, The whole matter of map projections is vitiated by a very strange mixing of ultra-scientific scrupulousness in defining each separate projection with the most thoughtless, even ridiculous, carelessness in graphically illustrating these projections in comparison with one another.
Now, in the ordinary accounts of projections, appended to geographies or atlases, it seems customary to show all these disks, which we have just seen to be of different diameters, all to the same diameter. I have here a learned treatise on Projections, published by the United States Government, under the heading: "Report of the Superintendent of the United States Coast and Geodetic Survey for 1880." The appendix, prepared by Chas. A. Schott, is supplemented with six engraved plates and a chart illustrating the subject of projection, The plates are all very carefully made. The first one shows four different projections on one sheet, yet all drawn exactly the same size, whereas in reality each of the four hemispheres shown would be different in diameter if they all four represented projections of the same sized sphere,
In a paper purporting to show "relative values" of various projections, such a blunder is absolutely inexcusable, It makes comparison impossible and gives the student utterly erroneous ideas of all the inherent attributes of the various projections so scrupulously described in the text.
It is a much more mischievous habit than that of the average map maker who puts all countries, states and continents so
Attention is called to the vital question of scale in these illustrations, The whole matter of map projections is vitiated by a very strange mixing of ultra-scientific scrupulousness in defining each separate projection with the most thoughtless, even ridiculous, carelessness in graphically illustrating these projections in comparison with one another.
We have seen that the various disk projections
show a hemisphere with varying diameters, Thus,
the orthomorphic projection shows a disk containing
half the world exactly the same diameter as the sphere
from which it is derived. Each gnomonic facet is a square of the
same diameter, but only presenting one sixth of the earth's surface.
The globular projection shows half the world on a disk whose
diameter is half the sphere's circumference. In the stereographic
projection the hemisphere is projected on a disk whose diameter
is twice the sphere's diameter. An equal area hemispherical projection
would show still another diameter, one that would make the disk's
area equal to the area of the hemisphere it represents, (See Fig.
26.)
Now, in the ordinary accounts of projections, appended to geographies or atlases, it seems customary to show all these disks, which we have just seen to be of different diameters, all to the same diameter. I have here a learned treatise on Projections, published by the United States Government, under the heading: "Report of the Superintendent of the United States Coast and Geodetic Survey for 1880." The appendix, prepared by Chas. A. Schott, is supplemented with six engraved plates and a chart illustrating the subject of projection, The plates are all very carefully made. The first one shows four different projections on one sheet, yet all drawn exactly the same size, whereas in reality each of the four hemispheres shown would be different in diameter if they all four represented projections of the same sized sphere,
In a paper purporting to show "relative values" of various projections, such a blunder is absolutely inexcusable, It makes comparison impossible and gives the student utterly erroneous ideas of all the inherent attributes of the various projections so scrupulously described in the text.
It is a much more mischievous habit than that of the average map maker who puts all countries, states and continents so
158 ASSOCIATION OF ENGINEERING SOCIETIES.
that they fill the page of his book exactly, regardless
of their relative size.
I wish to draw particular attention to this, because it seems to be characteristic of the ultra-scientific method of making world projections heretofore, viz., over-scrupulousness regarding the means of producing projections combined with an absolutely exasperating indifference as to the ends achieved. Theoretical considerations, in other words, have outweighed practical ones.
Of the single world maps now in actual general use, by far the best known are Mercator's and Mollweide's, shown in Fig. 19 and 20. Both of these are here shown drawn to the same scale. They are both portraits of Mother Earth as represented on a globe, the actual gores of which have here been peeled off by soaking in hot water, then dried and pasted side by side as you see in Fig. 18.
Here, then, we have the facts as to the land and water areas, although mutilated by being cut into gores. In the mind's eye, however, you can piece them together well enough to make a few comparisons. All the parts of the land shown in black on these fusiform sections are also practically devoid of distortion, as well as of exaggeration.
Before making these comparisons, however, I will say a few words about this elliptical projection called variously Babinet's homolographic or equal surface, Mollweide's or the Equivalent. The distinctive character of this important projection is, as its name implies, a proportionality of areas on the sphere with the corresponding areas of the projection. This projection consists of an ellipse whose major axis is the length of the equator and whose minor axis is the length of a meridian.
To begin with, the area of such an ellipse is not the same as the area of the sphere it represents. The surface of a sphere 8 in. in diameter is about 201 sq. in., but an ellipse whose major and minor axes are, respectively, the circumference and semi-circumference of an 8-in. sphere contains an area of nearly 248 sq. in., an excess area of nearly 25 per cent.
This projection is the same as Mercator's at the equator where distances east and west are correct. Distances on the parallels are also fairly correct towards the center of the map.
The central meridian also is correct as far as distances north and south are concerned, but each meridian east and west of the central one becomes more and more elongated by reason of the increasing curvature. When this curvature increases to the arc of a circle, as it does at 90 degrees of longitude, east and
LAND MAP OF WORLD ON NEW PROJECTION.
159
west of the central meridian, we have a projection
of a hemisphere whose extreme or boundary meridians
already exceed their real length in the ratio of pi
: 2, or 157 to 100, an excess of nearly 60 per cent. Where,
for the sake of presenting the whole world in one ellipse,
meridian after meridian is added to this already elongated
arc until 90 degrees have been added each side in the form of two
lunettes, we have piled the Ossa of elongation on to the Pelion
of distortion until the boundaries of our map are bent and stretched
to an extreme that reaches and overlaps the limit of absurdity.
This brings us back from our digression to a comparison of Mercator's and Mollweide's portraits of Mother Earth with her actual features as revealed in the gores of a globe when laid flat. (See Fig. 18, 19 and 20.)
The enormous exaggeration of Mercator's chart is best expressed by stating that if the north pole were on an island or the south pole on a lake ten miles wide, both lake and isle would have to be drawn 24,000 miles wide, the same as the whole equator.
The outrageous distortion of Mollweide's map is best realized by placing the east and west boundaries of the map back to back. We then see that what should be one vertical meridian — a straight line from pole to pole (equivalent to the minor axis on the ellipse) — is now expressed by violently curved and elongated lines equivalent to the entire periphery of the ellipse.
Expressed mechanically, it is easy to see that neither a pair of disks, a rectangle nor an ellipse can be accurately made to represent the covering of a sphere.
Projections of these forms, however, are universally used to show the whole or half the world on one map.
In the English-speaking world, Mercator's is more general; on the European continent Mollweide's obtains greater favor. It is obvious that before publishers will abandon either of these time-honored projections and scrap the many expensive plates on which they are engraved or lithographed, some very decided improvement must be offered which may reasonably be counted on as likely to be in universal demand by scientists, teachers and the public. To change the accepted maps of the world requires a great effort like a revolution in government or a reformation in religion. It is plain, also, that while the abuses or the inadequacy of the world maps now printed may be generally recognized and even deplored, there will be small chance for minor improvements, half-studied projections or unscientific compromises being generally adopted.
160 ASSOCIATION OF ENGINEERING SOCIETIES.
Thus the Van der Grinten projection (see Fig.
21) is, in a sense, a compromise
between Mollweide's and Mercator's, with very much less distortion than
the former and not so much exaggeration as the latter. It is a hybrid
map in a sense, and, like other hybrids, does not inherit the virtues of
its forbears. It cannot be repeated east and west like Mercator's, nor
has it Mercator's angular accuracy so useful to navigators
nor the rectilinear boundaries by which regional charts may
be correlated or connected. Nor has this map the advantages
of equivalent areas found in Mollweide's. Its circular form,
moreover, is unscientific. For all that, its appearance
marks a protest and is a valuable contribution to the movement
inasmuch as it unsettles fixed acquiescence in the established
projections and no doubt has prepared the world for a more
rational one by at least drawing attention to the need of it if
nothing more.
The fact, moreover, that the author of this new projection was enabled to secure patent rights is not without interest.
I come now to consider another school of world-map projections not developed from any of those heretofore mentioned. The new type calls for all of the principles and practices developed in making the skiagraphic maps whether direct or onto developable surfaces of cone and cylinder; also the mathematical analysis necessary to construct maps by development and plotting used for obtaining a high degree of accuracy in the making of regional maps. Of such are Bonne's, Flamsteed's and Hassler's polyconic projections. Of these, Flamsteed's is similar to Mollweide's; and Bonne's and the polyconic are admittedly quite unsuitable for single maps of the entire world. (See Fig. 22 and 48.)
The latest type of world map projections bears somewhat the relation to the classic and the mathematical projections of the ancients and moderns that science based on experiment and applied to practical ends does to synthetical and analytical science in the abstract. I merely wish to suggest an analogy. The older scientific attitude is theoretical and ideal. The Greeks were mentally averse to experiments. The next trend after the synthetic or generalizing is towards the analytic or specializing. The third and final attitude of the mind is to drop ideal and comprehensive theories on the one hand, to withdraw from hair-splitting details on the other, and to look to the actual facts as we find them by experiment and to apply our knowledge so obtained to the direct needs of humanity and the hour.
LAND MAP OF WORLD ON NEW PROJECTION.
161
But it must not be forgotten that the large view
of the first method and the grasp of detail developed
in the second will both be needed in the final compromise.
The older projectionists conceived the world geometrically as a sphere, all parts of which were of equal interest. The most recent school of projectionists takes cognizance of the actual shape of the land and water as they are distributed over the globe. And this suggests that the earliest scientific attitude towards any problem is necessarily theoretical, seeing that all the facts are often unknown until a comparatively late date.
It is only recently, in a scientific sense, that we have learned the facts regarding the shape of the continents, and very much more recently, that is to say, in this very generation, that the boundaries of the world's colonies on the dark continent, for example, have received definite delimitation. Therefore, while the outlines of the water-world have been known for over three centuries, the outlines of our land-world have only been established three decades.
Mercator's chart admirably serves the purposes of navigation, the one problem of which is to find one's way from port to port. The need of a single land map without the exaggeration of this chart or the distortion of Mollweide's has now become as imperative as the need of a sea-map was in the sixteenth century.
In the new school of world maps, then, the problem is approached from a new viewpoint. And it may here be noted that many of the most brilliant discoveries and most useful inventions have been made by "outsiders" — men not trained wholly in that particular science to which they so often contribute so much.
It is not easy to indicate the first step taken
to make land maps of the world as distinguished
from sea maps; or when advantage was first taken of
the contour of the continents by plotting the northern
land mass on a plane tangent to the north pole, or at any rate
parallel with the equator, with developed radial extensions.
This type of world-map in which the continental peninsulas below
the equator are carried in star-shaped extensions seems, however,
to have originated in Germany, at least so I gather from
a letter from Mr. E. A. Reeves, the map curator of the Royal Geographical
Society of London. In Germain's Traite des Projections
is an account of such a map brought out fifty years ago by
Dr. Jager and modified by Dr. A. Petermann.
162 ASSOCIATION OF ENGINEERING SOCIETIES.
Another such stellar projection is described in
Prof. Dr. Karl Zoppritz, "Leitfaden der Kartenentwurfslehre."
Of this type, also, is the quincuncial projection
devised by Prof. Charles Pierce, and another five-pointed
star-map printed in Stieler's Atlas. In spite of the fact
that some authorities contend that this type of projection is
of little practical value, it is to be noted that it is being more
and more used and that the geographies of the American Book Company
make use of polar maps with star extensions in several of their publications.
As this company is the largest school-book publishing house in the
United States, and probably in the world, I consider this fact
of very great importance. It is noteworthy that both a five-pointed
and a six-pointed star-map are used by this firm. In the "Natural
School Geography" (Redway and Hinman) a six-pointed polar projection,
together with the hemispheres on the equator, are printed on a full
page, as shown in Fig. 23.
This star projection is printed in other parts of the book. The star
extensions start at 20 degrees west of Greenwich on the equator, each
being 60 degrees wide and having the bounding meridians curved. All
parallels both north and south are concentric. On this map the northern
hemisphere is plotted on a different projection from the southern,
which occupies a larger area. The equatorial regions are very much
distorted. Moreover, the boundary meridians of the southern star
extensions are so poorly selected that parts of the East African coast
are mutilated and sheared off along with Madagascar into a separate
lobe, while a similar mutilation happens to the west coast of South
America.
Another book, smaller in size, the "Eclectic Physical Geography," by Hinman, of the same firm, contains a five-pointed polar projection which is used four times for different purposes. In construction, the northern hemisphere down to the equator is similar to the six-pointed map, but the southern extensions are five in number and 72 degrees wide, commencing at the meridian of 100° west. This map is shown in Fig. 24. While Africa and South America are both shown intact, Madagascar is cut at longitude 44°, the dividing meridian, and most of the island separated from the lobe containing the mainland of Africa. On the other hand, New Zealand in this map is included in the same lobe with most of the Australian continent. But this is no advantage, because New Zealand is separated from Australia by over a thousand miles, and is, moreover, geologically, biologically and politically entirely distinct from the continent of Australia. But the island continent which should, in all logic, be wholly
Another book, smaller in size, the "Eclectic Physical Geography," by Hinman, of the same firm, contains a five-pointed polar projection which is used four times for different purposes. In construction, the northern hemisphere down to the equator is similar to the six-pointed map, but the southern extensions are five in number and 72 degrees wide, commencing at the meridian of 100° west. This map is shown in Fig. 24. While Africa and South America are both shown intact, Madagascar is cut at longitude 44°, the dividing meridian, and most of the island separated from the lobe containing the mainland of Africa. On the other hand, New Zealand in this map is included in the same lobe with most of the Australian continent. But this is no advantage, because New Zealand is separated from Australia by over a thousand miles, and is, moreover, geologically, biologically and politically entirely distinct from the continent of Australia. But the island continent which should, in all logic, be wholly
LAND MAP OF WORLD ON NEW PROJECTION.
163
included in a lobe of its own, has its entire
west coast split off at the 116th meridian. Even Perth, the capital of Western
Australia, is separated from most of the mainland.
This dividing meridian, below the equator, also rends
asunder part of the large island of Borneo and separates
by a wide gap of space one half of the East Indian Archipelago
from the other. Unlike the New Zealand group, these islands
are part of one continental plateau, — geologically, biologically
and politically one. No division could be more illogical and
unscientific, and I have often wondered how such an impracticable
and arbitrary projection could be described with so much mathematical
pomp and circumstance as this quincuncial arrangement. It
is also a matter of astonishment that so slovenly a map should
achieve the dignity of being nicely engraved and colored and
printed off in millions of copies. None the less with all its
imperfections and mutilations, this projection is actually,
for a great many purposes, far better than either Mollweide's
or Mercator's. That is why it is used.
Still another polar map of the world, with eight-pointed extensions, is printed in an atlas published by J. W. Bartholomew & Co., of Edinburgh. The triangular extensions on this map contain 45 degrees of longitude each. The series commences at 100° East or 80° West. This projection is shown in Fig. 25. South America is slightly mutilated by the 80th meridian west, and so is Africa by the 10th meridian east. The Australian lobe cuts into Sumatra at 100° E. Longitude and at the 145th meridian east cuts the most important states of the Australian commonwealth in two, viz., Queensland, New South Wales and Victoria, to say nothing of the islands of New Guinea and Tasmania, which are also split asunder in this map.
It seems amazing that the originators of these star-shaped polar maps should seemingly have gone out of their way to mutilate the continents by dividing their maps below the equator into five, six and eight divisions, when the world itself is plainly, simply and grandly divided into four, viz., South America, Africa, Australia and Polynesia of the Pacific, dominated by the New Zealand group. Two of the systems just described began making the initial goring at longitude 20° West. Nothing could be easier than to include 90 degrees in each lobe from this starting point, and so develop a map of the greatest simplicity with all the gorings well out to sea. It is a truly astonishing thing, but it bears out the point I made at the beginning of my paper, that your mathematician often combines a prodigious amount of learning in his methods with a prodigious amount of
164 ASSOCIATION OF ENGINEERING SOCIETIES.
stupidity in his results. On the other hand, it
must be admitted that simplicity in most things
is attained by a circuitous route through all manner
of complications.
All the maps described above have four serious drawbacks.
In recovering from one long-established error mankind is apt to rebound to an opposite extreme. Having long looked at the world from the equator in both Mercator's and Mollweide's projection, it is not to be wondered at that the first maps in revolt at this practice should go to the other extreme and view the world from the pole. This is the first mistake. The second mistake is that of crowding the whole northern hemisphere into one disk; and we have seen that no projection is wholly satisfactory which attempts this, because either the edges are too crowded, the center is too compressed, or the periphery too much extended. The third fault with the polar maps, above described, is the lack of symmetry north and south of the equator. That is to say, the method of projection for any one group of meridians forming a southern lobe, whether in five, six or eight sections, differs from the method used for the same longitudes in the northern hemisphere. Moreover, in the six-lobed map the extensions have curved sides like the petals of a flower. If the map is cut from the paper these southern "petals" when folded back will meet at a point at the south pole, but the sides will not fit, they will lap over one another. In the case of the five-and eight-pointed star-maps, whose rays are bounded by straight lines, when folded back the sections will, it is true, fit together, but the parallels of southern latitude will not be rings concentric with the south pole, but a series of five and eight concave loops looking somewhat like a spider's web; the result being that similar latitudes north and south of the equator do not correspond. Each is distorted in a different, a discordant, way.
The fourth error lies in the number of lobes or extensions on which the southern hemisphere is to be carried and the careless selection of the meridians delimiting the same.
The second and last error mentioned above have been avoided in a four-lobed polar projection invented by Lord Belhaven and published by J. G. Bartholomew & Co. (See Fig. 26.) While the mistake is made of putting the north pole in the most important place, and while the southern lobes are of a different type from the corresponding northern ones, this projection is an equal area one; the continents are correctly grouped, and advantage is taken of the shape of the land, which
LAND MAP OF WORLD ON NEW PROJECTION.
165
makes it possible to include the northern lithosphere
in a circular projection, which does not go lower
than 25° N. Latitude. The splitting of the lower part
of the map into four lobes commences, not at the equator,
therefore, but at 25° N. Latitude, and 20° W. Longitude.
A minor imperfection could so easily have been avoided that
it is worth mentioning. As this map is printed, there is a mutilation
or splitting asunder of Lower California on longitude 110°
West and the peninsula of Gujerat on longitude 70° East.
Now both these defects could have been so easily remedied by
starting the articulated part of the map at longitude 25° West,
just as it starts at latitude N. 25°. Why, in the name of sense
and symmetry, this was not done before the map was so beautifully engraved,
it is difficult to understand. With this readjustment of the split
meridians the land masses remain intact. By goring 65° E. Longitude
instead of 70°, the point of scission commences some twenty-five
miles from the coast of Baluchistan and hundreds of miles west of Cutch
and Gujerat. At the same time the goring at 115° W. Longitude and
25° N. Latitude is nearly two hundred miles away from the coast
of Lower or Mexican California. By this change, too, the east coast
of Australia is brought closer, but not too close to the map's boundary
at 155° E. Longitude, about one hundred miles.
Thus amended, or even as it stands, this map is a great advance on all other polar maps with radial extensions. Nevertheless, as I have pointed out in my original memoir, published in the Scottish Geographical Magazine, this projection is in several ways unsatisfactory.
And here I should state the rather remarkable fact that, while I was preparing this account of my five years' work on this problem, Mr. J. W. Bartholomew sent me a progress proof of the Belhaven projection I have just been describing. I do not know how it is with you engineers, but we architects have a way of making plan after plan of a proposed building until we succeed in reaching the nearest to perfection that lies in us. And so with this map. I have made a great many sketch projections on all conceivable lines. Among these tentative experiments was one that was practically identical with the Belhaven projection, but amended as I have above described. The parallels drawn as concentric rings from the north pole down below the equator to the south pole, to secure equal area properties to the map, was suggested by the late Edward Wesson, Assyriologist and astronomer. This feature assumed pencil form, but was soon abandoned for a symmetrical arrangement of coördinates,
166 ASSOCIATION OF ENGINEERING SOCIETIES.
north and south of the equator, which was drawn
in four straight lines at right angles to one another.
In explaining why this whole scheme was abandoned, I was criticising my own map at a certain stage, although I used actual features from the Belhaven map to drive home my argument and reasons for abandoning the polar aspect of my projection.
I quote from the original memoir:
In explaining why this whole scheme was abandoned, I was criticising my own map at a certain stage, although I used actual features from the Belhaven map to drive home my argument and reasons for abandoning the polar aspect of my projection.
I quote from the original memoir:
"In projecting the circumpolar world down to 25° N. Latitude, it soon became evident that the attempt to crowd the spherical area of an inverted bowl on to a disk no bigger than the periphery of its rim was a feat involving grave error; to spread the bowl out involved error in an opposite direction. To include the bowl's actual surface on a circle somewhat between the two was a scientific solution but one involving serious distortion. Fig. 27 shows an 'elevation' and a developed' plan' in 15 degrees gores of the world's top as described above. When the lower disk has been mathematically contracted, so that latitude is compressed and longitude is extended until the black wedges disappear, we have a circular projection such as is shown in the Belhaven map. But, in getting rid of exaggerations and attaining equal area properties, we have been compelled to distort the map as we recede from the pole, getting wider and wider in longitude and narrower and narrower in latitude until at 25° N., where the gorings commence, we have lateral distortion of Northern Africa and the whole region around the tropic of Cancer that is excessive. But, worse than this, having started on a career of ever-increasing distortion, so that degrees of longitude are very noticeably exaggerated at the rim of our northern disk, it is found necessary to keep on bulging our longitude (and also squeezing our latitude) right on for 25 degrees more until we reach the equator. The result is best shown by comparing Africa, Australia and South America, as plotted on this projection, with the actual shapes of these continents when viewed and mapped independently. [See Fig. 28 to 33.]
"While a great improvement on all other stellar projections, and while we have seen similar, though inferior, maps of this polar type put to considerable use for special purposes, it is clear that it is not good enough for universal use unless these defects of distortion and distance can be righted and other advantages added, especially in the matters of securing a uniform type of projection for regions north and south of the equator, and some means of adapting the same map to Austral as well as Boreal continuity.
"If, in addition to these good points. we can make our map roughly scalable in linear miles and so constructed that a large continuous world map can be made to fold into portable form for desk use, thus forming at once a regional atlas and a world map to a uniform scale, we shall, I think, have solved the problem originally set before us."
LAND MAP OF WORLD ON NEW PROJECTION.
167
II.
A method of projection, like a plan or a recipe,
is merely a means to an end. The proof is in the
map, not in the mathematics behind it. No doubt the plans
and specifications for the Quebec Bridge looked as satisfactory
as those for the Forth Bridge. But the one collapsed and
the other stands. No one can tell by examining the mechanism whether
a flying machine will leave the earth or not. Yet a machine
that will rise and one that won't look remarkably alike. I
am impelled to these remarks by the comments made by some regarding
the world map I am about to describe. I am told that my projection
is "not dissimilar to other projections of the same kind, none
of which have been found to be of much practical use." Now, I have
described several in detail and have shown that some of them have
been put to considerable practical use, in spite of their imperfections.
It will also appear that the new map is not at all like other polar
maps with radial extensions; the resemblance is a superficial one.
In all attempts to flatten out a spherical surface, one fact persists, and that is that there is always a region of maximum accuracy, and that this decreases as one recedes from this region. This region of maximum accuracy radiates from the point of contact in tangent circular projections and is transverse to the line of contact in cylindrical or conical ones. Now, the fault with Mercator's, Mollweide's and Van der Grinten's lies in the fact that all the accuracy is on the equator, which is not the most important part of the world. In the stellar maps, such as we have been discussing, all the accuracy has been centered at the north pole, which is very much less important. Is it not extremely illogical to waste the precious and restricted accuracy of a world map either on the torrid zone or the untraversed frozen Arctic? The perfect map will follow the good old Greek rule "to metron ariston," and, avoiding extremes of heat and cold, will center its interest and its accuracy at the temperate zones, between the two, where, not only most of the land of the world is grouped, but where the activities of the human race have reached their highest development.
In Fig. 18 the gores that make up a globe are arranged side by side at the equator. In Fig. 27 they are brought to a point at the pole. One sees at a glance that neither of these arrangements in the rough gives such coherence to the continental land masses as Fig. 36, which shows neither a cylinder around, nor a disk on top, but a cone athwart the world. You can see at a
168 ASSOCIATION OF ENGINEERING SOCIETIES.
glance that one only has to group the outlying
southern ends of the world into four sheaths and
the thing is done.
Fig. 37 shows the world drawn on this basis. A further improvement consists in goring the equator (Fig. 38 and 39). It will now be seen that if the boundary of the African lobe be shifted from 25° W. to 22 1/2°, and the dividing meridian also carried 22 1/2° from the equator and the poles, that the whole map consists of eight equilateral curvilinear triangles assembled together on boundaries which for half their length are straightened.
In other words, each lobe has 90° of latitude and 90° of longitude. Half its boundary is straight and half curved. The temperate zones are in secant conical projection with straight radiating meridians. The parallels are concentric arcs of circles. In the Arctic and torrid zones the meridians are curved. Each lobe has shape and projection similar to each other lobe, and the southern lobes can fold under the northern lobes, so that the Austral hemisphere can be seen in the same relation as the Boreal hemisphere. Each lobe is based on an equilateral triangle (Fig. 40 and 41), and the whole world is contained in 240 degrees of are, so that a repeat section can be added both east and west, as in Mercator's projection, to show how the beginning of the map is joined to the end. The map can be hung in seven different positions, each in turn giving maximum prominence to a different region, or it can be made to rotate. All the lobes can be doubled over each other, so that a folded atlas of pocket size can be displayed to the size of a convenient desk map of the world; or a regional atlas of folio dimensions for library use can be unfolded to the bold dimensions of a great wall map. All maps on this projection are to be printed to the same scale as the stock globes in use in the country of their publication. Tests with compass or calipers from the globe to the map will show that dimensions on the globe agree in the main with dimensions on the map, a test impossible to apply to any other projection known.
Although not a map for marine purposes, it will be found that as trade routes run east and west in the northern hemisphere and north and south in the southern hemisphere, practically all the important shipping lines of the world will show on the map in absolute integrity from port to port. And, since all straight lines on each lobe closely approximate arcs of great circles, the apparent route from port to port is also the real route. For an example, one has only to compare the course from Panama to Yokohama on Mercator's chart with the course on the new map, shown in Fig. 49 and 50 and elsewhere.
LAND MAP OF WORLD ON NEW PROJECTION. 169
On Mercator's chart this course goes at least 1,500
miles west of San Francisco, if the ports are connected by a straight line.
The real great circle route goes from Panama to Galveston, through Texas,
west of San Francisco, out into the Pacific above Portland, up to Alaska
and down the east coast of Asia to Japan. The course on the new map is practically
identical with the course traced on a globe.
Regarding the property of correct "direction," the map shows lines of latitude and longitude crossing each other at equal angles throughout the entire temperate zones. These angles in the land regions of the torrid zone are also in the main equal to each other, the oblique angles of intersection being confined to the corners of each lobe.
A much clearer conception of this projection is made possible by realizing that only one eighth of the surface of the sphere is projected on to a plane, and that these eight maps are then assembled into one map as can be clearly grasped by glancing at Fig. 35.
When this drawing had been made and after the publication of the Memoir, I chanced to find in an old number of Harper's Magazine a map of the world attributed to Leonardo da Vinci. It is based on this idea of cutting the world into octants. No attempt, however, is made to fit them into one map, nor are they assembled together at their sides in the form of a loop or festoon by which the temperate regions are united, but they are arranged in a quatrefoil around a polar center (Fig. 34).
I will now show you a mechanical demonstration of the great accuracy of this projection. Long after it was developed and perfected, and after I had peeled oranges and laid the skins flat by the method of the map, it occurred to me one day to try the experiment on a rubber ball.
I took a hollow rubber one about 2 in. in diameter. On this I drew lines of latitude and longitude 22 1/2 degrees apart, starting at zero. I then carefully drew in the outlines of the continents. The result was a miniature globe on resilient rubber instead of stiff papier maché. Now, the principle of my projection, which, in a mechanical sense, consists in cutting the covering of a sphere so as to lay it out flat, can be applied practically to such a globe in a manner that demonstrates both the accuracy of the projection and the simplicity of its construction in a way that is absolutely and instantaneously convincing. (See Fig. 44 and 45 and compare with 42 and 43.)
Three great circles form the boundaries of the adhering
170 ASSOCIATION OF ENGINEERING SOCIETIES.
lobes, viz., (I) The equator; (2) 22 1/2°
West, including 157 1/2° East; (3) also at right angles to
this double meridian 67 1/2° East, including 112
1/2° West. These three great circles cross each other
at right angles (and no more than three great circles can do
so) at six intersecting nodes, two at the poles and four on the
equator all well out to sea. Of these, two are at the east and west
sides of the Pacific respectively, one is in the Atlantic and one
in the Indian Ocean. Now, as we have realized that some sacrifice
must be made to lay a sphere flat, and as we have agreed to sacrifice
the oceans at the equator and the poles, we cut six Latin crosses
in the covering of the sphere at these six nodes, each arm of each
cross being 22 1/2° long. And it is amazing to note how the very
forms of the continents and oceans seem, as your secretary, Mr. Von
Geldern, says, "as though made by design to fit this
particular division and goring." No important part
of the inhabited world is mutilated, by these scissions.
Now, when the four southern boundary meridians have been cut through,
and one of the four northern ones, the rubber globelet can be
laid out flat and put behind glass and photographed as in Fig. 44 and 45. When the glass is removed the
rubber map leaps back of its own resilience and once more becomes
a globe. The strain needed to flatten the rubber lobes has not
even cracked the ink, and the minute change wrought on the surface
by this flattening process is wholly imperceptible to the naked
eye.
Now, if, as Professor See of the Mare Island Naval Observatory says, the ideal way to study the world is by use of a globe, and all geographers are agreed on this point, it follows that a map which is identical with the surface of a globe, laid out literally on a plane, must be the best as being nearest to an actual globe. Fig. 45 is practically a photograph facing eight sections of a globe laid flat. I will go further and say that a map so made has advantages that a globe has not. One of them is that the map shows the entire world at one coup d'œil, whereas on a large globe one can only see about a third of the earth's surface at one time.
Regarding these split rubber globes, one of which, I propose, shall accompany each school map on the new projection, Prof. Paul Goode of the Chicago University writes: "It seems to me that this device [the dissected globe] is the very best object lesson that has ever been proposed for connecting in the beginner's mind the relation between the map and the globe." He concludes by expressing the hope that these little toy globes should be in use in all the primary schools of the country.
LAND MAP OF WORLD ON NEW PROJECTION.
171
Regarding the projection itself, I have received
encouragement and endorsement from leading professors
of geography and cartography in the universities of Europe
and America, including Berlin, Paris, London, Oxford,
Harvard, Chicago and California. Among cartographers I have
received marked encouragement from Dr. M. Groll, of Berlin. Among
scientists in general I treasure the approval of the venerable
Dr. Alfred Russel Wallace, who expresses his appreciation of my
projection as being "more accurate than any other yet attempted."
An example of how this projection finds favor is quoted below from
an article in the Scottish Geographical Magazine by Stephen
Smith, B.Sc., F.R.S.G.S.
"Every one who is interested in the teaching of geography should hail with satisfaction the production of a map of the world based on the method suggested by Mr. Cahill in his paper in the September number of this magazine. No projection of the hemispheres, stereographic or globular, no 'equal area' projection of the whole of the earth's surface, no gnomonic and no cylindrical projection can give at once such a comprehensive and accurate representation of the globe on a flat surface as the map which is here shown [Fig. 42]. Its form is almost self-explanatory of the method of its construction, which is so simple that the merest child can easily understand it. Its accuracy is amply sufficient for all ordinary requirements. In short, it is admirable."
III.
Regarding the uses to which a new world map can
be put; you will naturally have already come to some
conclusions on this point when you have come to realize
that so far world maps have in the main been made for mariners
— "ad usum navigantium" is part of Mercator's title to
his famous chart engraved in 1569. Theoretically, Mollweide's
map is the one for landsmen's use, but its distortions are
so repellant that a great publishing firm, J. G. Bartholomew &
Co., of Edinburgh, instinctively reject it, and in their Commercial
Atlas prefer the exaggerations of Mercator, in spite of the fact
that the whole end and object of a Commercial Atlas is to show by
patches of color the regions where various commodities are found,
raised or exchanged for purposes of comparison one with another!
The selection of Mercator's projection by British map makers is probably due to the maritime training and habit of the British people, who have used Mercator's chart more than any other nation. But we have seen the evidence of dissatisfaction and various attempts to find a rational substitute. Unless, therefore, some map is adopted that commends itself to universal
The selection of Mercator's projection by British map makers is probably due to the maritime training and habit of the British people, who have used Mercator's chart more than any other nation. But we have seen the evidence of dissatisfaction and various attempts to find a rational substitute. Unless, therefore, some map is adopted that commends itself to universal
172 ASSOCIATION OF ENGINEERING SOCIETIES.
adoption by reason of its demonstrably transcending
merit, we shall go on using all kinds of world maps
according to the taste and fancy of different publishers
in different countries, and all this to the confusion of
students and the hampering of science in general.
Now, a world map, by its very nature, should have an international quality. All nations have a similar interest in this, the ground plan of our common dwelling-place, the habitable earth. A broadly conceived simple symmetrical projection, therefore, which envisages the true shape of all the lands of the world without favor to anyone region, an absolutely logical, truthful and impartial framework or diagram of the nations' boundaries by themselves and in their relations with one another, must inevitably prove a boon and a blessing to the whole civilized world. That such a suggestion should come from the New World about the same time that the scheme for a giant globe was projected in the Old World is not without significance. I say giant globe advisedly, for reasons which will appear later on. The official title of this great undertaking is, however, "The International Millionth Map." This project is a sort of splendid antithesis to the projection I have been describing, and you will note that etymologically the same word covers both extremes. The first proposed a huge analysis in map form containing all the geographical facts of the surface of the earth to a uniform scale, prepared by joint effort of all nations, whereas the second forms a compact synthesis to a small scale, whereby all the broad results of the great detail sheets can be focused and viewed in a uniform presentation for the benefit of all nations. The one is complementary to the other, as I shall show. Oddly enough, both enterprises were independently launched about the same time.
The idea of the great International Map of the World originated with Prof. Dr. Albrecht Penck, then of Vienna, now of Berlin, who, by the way, lectured at Berkeley four years ago. I was present at the lecture and made notes of it on the back of the manuscript of my map projection which I had just completed. At that time, however, I had never heard of Dr. Penck's proposal. It took definite shape later, at an International Conference called by the British Government and held at the Foreign Office in London under the chairmanship of Col. S. C. N. Grant, R. E. Mr. S. J. Rubel and Mr. Bailey Willis represented the United States. The British empire was represented by five delegates, including one from Canada and one
LAND MAP OF WORLD ON NEW PROJECTION.
173
from Australia. Germany was represented by three
delegates; France by four; Austria and Hungary by three;
Russia, Italy and Spain by one each. No more momentous
gathering ever assembled in the history of map making. It
was proposed to map the entire surface of the sphere to a uniform
scale of one millionth, in linear dimension, of natural size, which
is one millimeter to the kilometer, or 15.78 miles to the inch.
Uniform spelling and nomenclature were to be adopted. Elevations
and depressions were to be shown by the hypsometric method
of contour lines at designated altitudes; navigable rivers, roads,
railroads, telegraphs, towns and boundaries, etc., were all
to be shown by uniform prescribed symbols.
Now, regarding the most interesting feature of this map, from my point of view, viz., the projection, the reports in popular journals are confusing. Not only is the average man somewhat at sea on this question, but occasionally even experts make quite astonishing statements, For example, I opened a book the other day entitled, "The New Basis of Geography," by J. W. Redway, published by Macmillan & Co. On page 160 is the following: "The Mercator projection is intended primarily as a chart for the use of sailors. Its great merit lies in the fact that a straight line on the chart practically represents the arc of a great circle," the truth being that all lines directly north and south do, and one line east and west, the equator. All other lines, representing arcs of great circles, are curved, some very much so.
We are told that the giant map is to measure about 30 by 45 meters, or 100 by 150 ft., and that the projection adopted must allow every sheet to be fitted exactly with each of the other four sheets adjoining its four sides, and that the polyconic projection permits of this arrangement. This is a very misleading statement. One would imagine that each sheet, when added to its neighbor, would form a compact uniform map of the world on a plane 150 by 190 ft. If that were as easy as it sounds there would be no need to worry about projections. Of course, nothing of the kind is possible, as I shall show.
The explanation is of interest to engineers and architects, because it demonstrates that we are used to problems of projections in a more intimate and practical sense than either geographers or mathematicians, and also that the very last word in map making on the most colossal scale, and according to the most recently developed method, known as the polyconic,
174 ASSOCIATION OF ENGINEERING SOCIETIES.
is in effect a return to the simple methods of
developing the coverings of solids, as taught in the
rudiments of carpentry and building, such as are used to
construct the forms for a dome or the paneling of a cupola.
Each sheet of the International Map is to be 6 degrees wide and
4 degrees high. Starting from the equator there will be twenty-two
rows of sixty sheets each, reaching to 88° North, where the series
ends. They are lettered from A to V respectively. Each
of the sixty sheets, between each pair of parallels, will be numbered
from 180 degrees, which will be No. 1, to the last sheet, which
will be No. 60.
Now, the polyconic projection is based on a central meridian, which is vertical. As each parallel is developed from a separate cone, the parallels are curves and the lateral or boundary meridians are necessarily curved also. If each meridian were added east and west to the central one, we should get a map based on the coördinates as shown in Fig. 22, a preposterous and ridiculous thing, and not at all the principle of the Millionth Map. On the other hand, if each sheet has curved sides, not one will fit its neighbor.
Now, as the curvature of the flanking meridians, on so large a scale, will be very slight, especially as each boundary meridian is removed only three degrees from the straight central one, I think I am right in assuming that the meridians on each sheet will all be straight lines. They will, however, be slightly inclined towards the center, which inclination will, of course, increase as they pass from the A belt at the equator to the V belt near the poles. Also, it is clear that all meridians on each sheet, if extended beyond, will meet in a common center. It is also clear that each sheet, with its entire series of lateral sheets, represents a small section of a series of truncated cones, 22 in number, the first one, A, being extremely pointed like the cap of a clown, and the last one, V, being extremely flat, like the hat of a Japanese 'rickshawman. Each successive apex, moreover, becomes the center from which are drawn the parallel concentric arcs of latitude.
The arcs of latitude are parallel or concentric to one another in each sheet only, because each sheet, as we go north and south, has a different center. Therefore the north and south boundary arcs do not exactly fit the boundary arcs above or below. But the difference in the width of one or two sheets is so slight that it may be ignored.
When the sheets are assembled in lateral rows, however, the parallels will meet at the sides of each sheet in a continuous
LAND MAP OF WORLD ON NEW PROJECTION. 175
arc of a circle, each row of sheets, however,
having its own special radius. (See Fig. 10 and 48.)
Now, this is not the polyconic projection as developed by Hassler for charting the eastern coast of the United States, wherein each individual parallel was developed on successive tangent cones. It is rather polyconic in the sense that each group of four parallels is developed on a separate secant cone cutting the sphere. That is to say, that a hemisphere is first conceived as a series of superimposed truncated sections of cones tangent to successive groups of parallels, each strip or ribbon of parallels, when unwound and laid flat, or developed, forming arcs of varying radius as we approach the poles. Each strip will contain sixty sheets.
Since there are sixty in number from east to west, and twenty-two from the equator to the poles, the total number for a hemisphere will be 1,320; add to this the polar cap, a polygon 4 degrees in diameter, and we get 1,321. Twice this will represent the whole sphere, which we now realize will contain 2,642 sheets. However, as each sheet narrows as it nears the pole it was agreed that above 60° North or below 60° South two or more sheets could be united east and west.
Fig. 48 shows how a sphere by this method would be developed on to plane surfaces, which we see take the shape of arcs of varying radius.
This method of developing the covering of a hemisphere is taken from the chapter on "Stereography" in an old treatise on "Carpentry and Building." It is a useful diagram for working out the details of a dome, supposing that the vaulting were to be carried out on twenty-two equal courses of stone. In the illustration, of course, the number of strips representing the different developing cones differs from those on the map, but the principle is all the more clearly seen on few strips than on many.
It is evident from this diagram that the International Map was never conceived as a unit world map, but as a vast and uniform storehouse of geographical knowledge to be issued from time to time by or under different governments until the known regions were all reduced to the same uniform expression. As travel and exploration in less known regions progressed, the sheets would be reissued. Ocean charts, as well as land surveys, would, of course, be considered of equal, in some cases of greater, importance.
I need not emphasize the fact that this is a mighty under-
176 ASSOCIATION OF ENGINEERING SOCIETIES.
taking. It will be many years before all the sheets
can be issued with even a fair amount of detail or accuracy,
and, of course, it can never be finished and never be perfect.
Meantime, you will observe, by examining the diagram, Fig. 48, that any number of sheets can be grouped side by side in arcs whose radii vary with the latitude; or on top of one another in fusiform strips. Wherever these systems intersect, a cross or quincunx of five sheets can be perfectly fitted, but the four corners cannot be fitted in without leaving feather edge wedges of space, like joints between the original group and the added sheets in the corners.
We have now disposed of the continuous map idea, and shown that, like the world itself, the only way in which all the 2,642 sheets can be exactly combined is to paste them together (each row being at a slight angle to the row above), on a 42-ft. globe, or what is approximately a globe. Now, at the present moment, not more than five sheets have been published. By 1915 probably a few hundred will be ready, so that if a millionth globe were actually constructed,* and it would be a very expensive undertaking, only a few patches here and there would be ready to paste on it, the rest of the world would have to be filled in from our present knowledge.
Now, a glance at Fig. 48 will make it clear that it is possible to assemble the sheets of the International Map with fair compactness on a flat plane, if they are grouped in the triangular form, as shown on the central portion. If this grouping of 330 sheets is repeated for each octant, and each octant fitted to its neighbor, as shown in Figs. 35, 42, 43 and 45, we have, in a general way, assembled all the sheets of the International Map in visible display on one plane much as the marble tessera of a mosaic design might be laid in mortar to make the butterfly design there shown, the gaps and inequalities which we have seen to be unavoidable being taken up and absorbed in the jointing. In detail, however, the sheets would not fit each other exactly at the margins. If, however, each sheet of the millionth map were to be printed or photographed on some woven material, — linen, duck or silk, — so that each piece could be stretched a little vertically and shrunken a little laterally, and if some pieces could be warped a little diagonally, it would be possible to assemble all the actual sheets of the Great Millionth International Map, with all their details complete, on one comprehensive
* See discussion, p. 207.— Ed.
LAND MAP OF WORLD ON NEW PROJECTION.
177
cartoon. (See Fig. 46 and 47.) For convenience,
such a map should be laid out on the ground and its mountains
and hills. done in relief in some suitable plastic medium.
Color should be used only for one purpose: to show natural
features, such as forests, cultivated land and deserts. Real
water could be used for the oceans over variously tinted shades
of green and blue, according to depths. Such a map would be about
136 ft. across. It could easily be constructed on the basement floor
of some permanent building, the supporting columns of which could
fit into the equatorial and polar gaps in the map. A railed and elevated
gangway could be constructed to follow the sinuosities of the map
in a continuous direction from start to finish. The underside of
this gangway could be used to carry a line of electric lights and reflectors,
so that the whole map under foot would be brilliantly illuminated,
while the onlooker above moved in a sort of darkened limbo, unlit
except for the reflected radiance of the illuminated "world" below.
In default of a permanent exhibit of this kind, a huge map on canvas to the full size of the International one would make a most interesting feature at the end of the great nave of the Educational Building of the forthcoming Panama-Pacific Exposition. If the map were marked off by latitude and longitude every four and six degrees respectively, a very graphic presentation would result of the exact size and number of the sheets of the Great International Map.
The particular projection which enables these sheets to be so united that the whole earth can be viewed in one plane would constitute San Francisco's contribution to this great enterprise formally inaugurated in London by the leading nations of the world.
Fig. 46 shows the coördinates of one lobe arranged in groups of one and two degrees, the patches hatched in show the exact relative sizes of the sheets forming the International Millionth Map. The groups of nine spaces show how nine sheets could be assembled at one time. See also Fig. 48.
Fig. 47 shows one of the finished sheets of the Millionth Map, The Boston Sheet, or "North K. 19."
I pass now to the consideration of the new projection of the world as applied to the science of meteorology.
Internationalism, now a sporadic and occasional thing, but destined in the future to be the keynote of all human endeavor, plays an important part in this science. The air above us knows no boundaries. A great storm depression a thousand
178 ASSOCIATION OF ENGINEERING SOCIETIES.
miles or more across, and traversing its own diameter
in a day, starts in Siberia, crosses the Pacific, passes
impartially over Canada and the United States and melts
away in mid-Europe. No region of the earth under one government
is large enough to track the whole path of any of those giant
waves and depressions of atmosphere which are continuously traversing
over the whole world.
Now, these" highs" and" lows," as they are called, are, in the main, circular. They are traced by connecting all telegraphic or radiographic reports of a uniform barometric pressure at a given hour. These readings are connected up by curved lines drawn on a map. From day to day they move, and the weather forecaster thereby can predict from certain observations the direction of these great waves and depressions, their velocity, the sharpness or pitch of their depression and the wind and weather developed in their track. This is done on a map. At present in this country Mercator's chart is used. See Fig. 49, which shows the North Pacific Ocean and United States as prepared by the Government, and another map including the same region and to the same scale, but drawn on the new projection, Fig. 50.
I have drawn on a globe three circles of exactly the same diameter, which I have transferred on to the latter map without noticeable change to their scale and shape. I have in the first Mercator map drawn these same circles by latitude and longitude. Now, it can readily be seen how a hypothetical storm movement changes its size and shape as it traverses different regions of the map, a fact that meteorologists find extremely baffling and inconvenient. On the other hand, a polar map gives undue prominence to the great frozen areas where no observatories are stationed and where no ships can send in radiograms. Moreover, the lower latitudes in such a map are unduly stretched and distorted.
Realizing these points, Prof. Alexander McAdie, the official forecaster at San Francisco, one of the most important stations in the Weather Service of the country, has written a paper entitled, "Charting Storms on the North Pacific," in which he points out that the new map has advantages over all others from the viewpoint of a practical meteorologist. The paper in question is now being published by the head office of the United States Weather Bureau at Washington, for distribution to all the substations throughout the country.
After quoting Dr. Cleveland Abbe as to the great import-
LAND MAP OF WORLD ON NEW PROJECTION.
179
ance of a rational projection for maps, giving
the general contours of storm areas, Professor McAdie
continues:
For South Africa, Australia and Argentina, of course, the same map can be used assembled around the South Pole, which has its own independent meteorology.
In view of the fact that there is talk of the organization of complete weather service in Indo-China and on the Chinese coast generally, including Korea and Japan, the need of more comprehensive surveys becomes obvious. While extensive
"In charting storm areas it is apparent . . . that the Mercator distortion is so great that it may well be eliminated from further consideration. Nor can regional maps be used to advantage . . . because meteorologists now require reports from extended areas. Radio communication has made possible the girdling of the globe. And the necessity of long-range forecasts, leading in time to seasonal forecasts, is now pressing. For the successful accomplishment of this the atmosphere must be charted and studied as a whole. It is an interesting fact that the daily weather map now issued at Washington contains reports covering the area from Nome, Alaska, to Sedisfjord, Iceland; and there is every prospect that, in the coming years, the daily weather map, issued at, various national central offices, will contain data for an entire hemisphere. It is particularly important, then, that some method of representing the earth's surface, suitable for the presentation of weather reports over the greatest possible area, and with the least possible distortion, be devised."The writer then points out that the new map, as shown on Fig. 50, exactly meets the requirements. Professor McAdie has also shown, by actual experiment, that this form of map has mechanical advantages not found in other maps. One of these is rotatability; another is the advantage afforded the extra two lobes. If these blank maps arc printed on thin transparent paper, one can be imposed on another successively by means of one pin in the center. By placing charts of diurnal change over one another, the progress of "highs" and "lows" can be seen for several days, whence their ultimate direction can be easily predicted. A map on Mercator's projection, including Nome, the Philippines and Panama, can be supplanted by a map to the same scale on the new projection, which includes the entire northern hemisphere on a sheet that is practically the same size. In meteorology, it should be noted that north of the equator is the whole world to those who dwell in the north. The equator is a neutral zone south of which meteorological phenomena do not affect us as far as we know.
For South Africa, Australia and Argentina, of course, the same map can be used assembled around the South Pole, which has its own independent meteorology.
In view of the fact that there is talk of the organization of complete weather service in Indo-China and on the Chinese coast generally, including Korea and Japan, the need of more comprehensive surveys becomes obvious. While extensive
180 ASSOCIATION OF ENGINEERING SOCIETIES.
international coöperation is often a matter
of difficulty and delay owing, for one thing, to the difference
of language, etc., the observed area, as regards meteorology,
could be very materially widened by a coöperation of
the American and the British Imperial weather services, which
would include radiograms from British shipping in transit. As
this is 60 per cent. of all shipping on all seas, and as British outposts
girdle the globe, a very good start would be made in one language.
If France and Russia could be included in the agreement, and all
these four nations are on the best of terms, the thing would be done.
The reports in the French language would cover the whole of Northern
Africa and the whole of Northern Asia not covered by Anglo-American
ones. All that would be needed would be the establishment of meteorological
stations at the right points over the vast areas of Russian Eurasia, English-speaking
America and Franco-British North Africa, with suitable wireless apparatus,
and the weather conditions of the whole northern hemisphere would
be well in hand.
If other nations, such as Germany, took a hand, so much the better; I merely wish to point out that with the English and French language (the latter being the official language of Russia) the maximum world coöperation could be achieved with the minimum of red tape and diplomacy.
The southern hemisphere with transient shipping, the Falkland Islands, Polynesia, Australasia, South Africa and perhaps a spot or two on the fringe of Antarctica, is already in the British Imperial control, and if in such matters as quantitative rainfall in cycles, etc., it is ever made clear that the northern and southern hemispheres are interrelated, as possibly the statistics, when gathered, will prove, why, then the world at large is still further the gainer by an international enterprise of extraordinary importance.
From "China to Peru" mankind, in the main, is, above all things, interested in the weather. It is the first and last topic on one's tongue. The real wealth of the world is in what grows, and the main industry in this and all great nations is agriculture.
A good proof of the importance of maps, as used in the weather service of this country, is in the fact that the United States Government alone prints between seven and eight million weather maps annually. I regret to say these are printed on the wrong projection, but that is an error which can, and I hope will, be corrected in due time.
LAND MAP OF WORLD ON NEW PROJECTION.
181
An important new use for maps of the world, and
more especially maps without distortion or exaggeration,
has been created by radiotelegraphy. No better map could be
used, because every wireless station is the center of a huge circle,
the possible field of its potentiality. A map of established stations
throughout the world would show a series of giant rings each
drawn with a different kind of line, and each intersecting some
other ring. On such a graphic system, only possible on an accurate
world map, can lines of world news be properly routed. Every radius
of every circle must necessarily be on a common scale easily and
quickly intelligible to operators all over the world, who also are
accustomed to and educated to use a uniform standard type of map.
For such uses the articulated folded map is of especial value, because
of its portable form and the facility with which any outlying part
of the map can be folded so as to line up with any adjacent sections.
It is a commonplace to speak of the shrinking of the world from the traveler's viewpoint. It is, moreover, no more expensive to go round the world than to stop at a first-class hotel. A map that would show world routes as intelligibly as a globe would be a boon to transportation companies and public alike. A folded world map, with all trunk lines of travel on land and sea in their true scale of distance and direction would be a revelation to that rapidly increasing class who travel over large distances for business as well as pleasure.
No better example of the special needs of an accurate world map, apart from the universal needs, can be brought forward than that of the colonial nations of the world and those nations whose territory covers immense areas like Russia, or whose territories are dispersed over immense areas like the United States.
The British empire covers nearly 12,000,000 square miles, one hundred times the area of the mother country. It extends over nearly all latitudes and all longitudes literally and not figuratively.
Indeed, I have established this amazing fact by careful examination of maps. Every parallel of latitude, from the southernmost point of the New Zealand islands to within five degrees of the north pole, passes somewhere through British territory with one exception of a few degrees which used to be British. Likewise every great circle of longitude from 0 degrees to 180 degrees passes through British territory, also with an exception of a few degrees passing through Kamchatka and
182 ASSOCIATION OF ENGINEERING SOCIETIES.
east of Australia. But, since 60 per cent. of ocean
shipping in transit is under the British flag, the high seas are also, in
a sense, more British than anything else.
Clearly, then, the British empire is in extent a veritable world empire and can be adequately mapped only on a world-map. That the need of such a map is keenly felt in the British Isles and in the Oversea Dominion is best realized by bearing in mind the agitation for Imperial school books, especially geographies, lately set in motion by such bodies as the "League of Empire," etc.
But the United States and France, Germany, Belgium, Holland, Portugal, even, have far-flung territories, colonies and outposts that cannot be shown at once on regional map, and which are utterly out of scale on Mercator's chart. For all these nations an accurate world-map makes a special appeal, and, while colonies and outposts of empire may be of little value in themselves, the mere fact of the possession or administration of them by a nation is a matter profoundly affecting the whole polity of that nation, for good or for bad as the case may be.
From the viewpoint of political economists, statesmen and students of Welt Polilik, a proportional map of the world will furnish a graphic diagram of inestimable value. The same may be said of all naval and military establishments. The material resources, intercommunication and strategic configuration of the world's territories cannot be properly presented on Mercator's map.
The overwhelming preponderance of Russia in Eurasia, as displayed on Mercator's projection, has no doubt had some effect on the chancelleries of Europe and on the journalists who create public opinion and prejudice. By the same token, the resources and influence of China and India have been popularly minimized for the same reason. Not only do we of North America feel bigger than Africa but very much bigger than South America. Well, one asks, why not? On Mercator's map North America looks twice the size of South America. By measurement the continents have nearly the same land area, whereas Africa is more than a million square miles bigger than either.
The supporters of the "ABC" Alliance in South America will not fail to appreciate a world-map which does justice to the great mass of magnificent territory their alliance consolidates — an area of the world's surface a third as large again and as fertile as the United States and Territory of Alaska combined, and destined — who knows? — to as glorious, a development!
LAND MAP OF WORLD ON NEW PROJECTION.
183
You will have gathered the obvious advantages of
a national map from the teacher's standpoint. The dissected globe makes plain
the projection to a child, and the map's first use could easily be in the
kindergarten. The ease with which one can master the world, as the Romans
did, by dividing it, is a matter of particular interest. The eight equilateral
divisions are so natural, and can be so readily explained by three knife
cuts through an orange, that the way the continental outlines fall into each
division can be easily and permanently fixed in the mind. Each vertical half
of the world is divided into four parts, beginning at a quarter of a part
west of 0. Each side of each of the eight parts is again divided into four.
By an odd sort of coincidence the spinal or central divisions seem also to
divide or define the continents. The extreme of North Cape and the Cape of
Good Hope are about on a central line. Cape Matapan, the southernmost point
of Europe, is also on the same line. The high and low points of the Asiatic
continent arc both a little west of the center of the lobe containing them,
and so is Cape Horn exactly in the center of the South American lobe. The
same central line also passes through Cape Columbia, the northernmost point
of the New World. The fourth set of lobes are water divisions, with the Hawaiian
Islands exactly on the central meridian.
For scientific purposes of comparison of all world-wide phenomena whatever for statistics, for graphic exposition after the manner now becoming more and more in vogue other map can have such a wide range of usefulness.
This subject alone, — perhaps the most important use of the map, — I could discuss at great length, but time does not permit.
I will conclude by calling your attention to a remarkable book published recently, which has been very favorably received throughout this country and Europe.
The book is entitled, "The Great Analysis: A Plea for a Rational World- Order." It is far ahead of the times; but as thought travels so much faster than action, this is to be expected. The unknown author* starts out by assuming this world has now for the first time attained complete, or almost complete, geographical self-consciousness, and that it is about time for men, or the leaders of men, to begin to think, not "continentally," as Alexander Hamilton advised, but "planetarily." The author inquires "whether the time has not come when a World-Order may not be projected on the basis of a competent knowledge or forecast of all the factors. I suggest that a new
* William Archer (1856-1924), Scottish literary critic and translator. — GK
184 ASSOCIATION OF ENGINEERING SOCIETIES.
instrument of precision lies ready to hand, needing
only an organizing genius, with a selected staff of assistants,
to make effective use of it on a sufficiently comprehensive
scale. . . . The instrument in question is none other than Statistics,
in the widest sense of the term, the quantitative study of social
and economic phenomena."
In other words, the author proposes a sort of joint action among all the leading nations of the whole world, with a view to systematic international coöperation in all matters whatsoever touching the welfare of humanity. It is a stupendous thought, not wholly new, because there was a sort of false dawn of the idea two centuries ago, but that the real dawn of such a movement is at hand, no thinking man will deny. Already it has begun. I have mentioned an international map and international meteorology. Recently we had the International Geographers amongst us. We know of several international languages from Volapuk to Esperanto. No science whatever but has now its international conferences. The postal, telegraphic, railway and steamship systems already have an international character; while banking, commerce, insurance and the flow of capital for industrial development are necessarily and inevitably international. Immigration and emigration, the solidarity of religion, labor, socialism and science are all wearing down the barriers of isolated nationalism. And just as the world is mathematically enmeshed in a vast reticulation of latitude and longitude, recognized by all civilized mankind, so it may be said that the material activities of the nations, too, are tied together in all directions with invisible filaments of mutual interest. A concerted movement to introduce order and purpose into the family of nations inhabiting the world is foreshadowed in the establishment of the Hague tribunal and in the movements for "international conciliation" and the abolition of war.
Now as the author of the "Great Analysis" has said: "The human intellect, organizing order bringing, must enlarge itself so as to embrace in one great conspectus the problems not of a parish, or of a nation, but of the pendent globe."
Now, it was in an attempt to show the possibilities of instituting a part of just such a problem that gave birth to this world-map enterprise.
I sought to show the potentialities for permanent peace and world-order of the combined English-speaking nations as they now occupy the earth, and while my inquiries, too, were based on graphic statistics, which could only be possible on
LAND MAP OF WORLD ON NEW PROJECTION.
185
the invention of a rational world-map, and while
the inquiry would in the main be primarily economic, its
ultimate implications might be accepted as universal and even
spiritual.
Thus, as an instrument of geosophical analysis and a true portrait of Mother Earth for the use of all her children, I have hoped that this map projection will serve not only the humbler purposes of the statisticians, but the higher needs of the sociologist and the statesman, that even, as a means of quickening and clarifying international problems, it may come to serve the nobler end dreamed of by the poet and help humanity a step nearer to that far-off idea, — "The parliament of man, the federation of the world."
Thus, as an instrument of geosophical analysis and a true portrait of Mother Earth for the use of all her children, I have hoped that this map projection will serve not only the humbler purposes of the statisticians, but the higher needs of the sociologist and the statesman, that even, as a means of quickening and clarifying international problems, it may come to serve the nobler end dreamed of by the poet and help humanity a step nearer to that far-off idea, — "The parliament of man, the federation of the world."
LAND MAP OF WORLD ON NEW PROJECTION. 205
DISCUSSION
MR. OTTO VON GELDERN — This is a most interesting
projection of the world which Mr. Cahill has shown us and
described to us tonight, and which he has developed after giving
this subject very serious thought and study. The more I think
of it, the better I like it.
Heretofore a globe has always appealed to me as the best geographical object lesson, but this, too, has its serious drawbacks; it is difficult to make measurements on a spherical surface, and only a portion of the world may be looked at at one time; in turning the globe we lose the relationship of its land locations.
I am convinced now that for showing the continents in their relative positions with a minumum of distortion there is no better graphic method available than Mr. Cahill's projection. A land chart comprising immense areas may be shown with greater relative accuracy by this method than by any other known to me.
It is well known that it is impossible to represent the surface of a sphere, or a large area of it, upon a plane without distortion. The usual methods for plotting land areas are applicable with sufficient accuracy for a comparatively small portion of the earth's surface, but, if the surface be a large one, the difficulty of retaining a unit scale becomes apparent at once, and increases with the size of the area to be developed.
There are a number of mathematical projections in use, each of which may well serve its intended purpose. Mr. Cahill has shown us a number of them, They are well known to geographers.
Mercator's projection, for instance, solved a great problem, and simplified navigation by an artifice deserving our fullest admiration. Yet its purpose is not to show the relative land areas, but to show relative bearings of land localities bordering the sea. Valuable as such a chart is for navigation, no one would recommend a Mercator projection for geographical land work. As we leave the equator and go towards either pole, the land representation becomes the most distorted deformity one can imagine.
The polyconic projection, which has its application in geodetic work almost exclusively, serves its purpose better than any other, and comparatively large areas may be represented by this method. The area of the United States, for instance,
206 ASSOCIATION OF ENGINEERING SOCIETIES.
is covered by 25 degrees of latitude and 60 degrees
of longitude; in such a chart there is little distortion.
At the central meridian, say, at Council Bluffs, the scale is
true; but at the borders, say, at Boston on the east, and between
Cape Blanco and Eureka on the west, the scale elongation is about
seven per cent. The greater the area covered, the greater this marginal
distortion becomes. It may readily be seen that the polyconic projection
is not applicable to a representation of the surface of the world.
Mr. Cahill's projection overcomes the main difficulties, and lends itself primarily to land maps covering immense surfaces. It will show the areas of the world's continents, and their relative positions, with less deformation than any other projection. The author accomplishes this by adopting a segregation of the globe into uniform gorings of 90 degrees. This particular method was chosen after many empirical trials, and his result is such that it seems as though the continents of the world were made by design to fit that particular division and goring which Mr. Cahill finally adopted as the most suitable. It is doubtful whether a better scheme could have been worked out to give the same satisfactory solution, the underlying principle being not to sever the continents or to cut off any part of them from one flap to appear upon another, and to accomplish all this with the minimum amount of deformation of the scale. I think that Mr. Cahill has been successful in this.
While a globe will always lend itself as the best representation to the eye of the young and the untutored, land charts become necessary in connection with it, and to my mind now there is nothing that will give as clear and comprehensive an oversight of the situation as the projection which Mr. Cahill has shown to us tonight. It will appeal to anyone after its main points have once been grasped.
Skeleton maps of this character may be used for innumerable purposes to illustrate commerce, wealth, population, industries, economic conditions, political, religious and racial divisions, weather and seismological statistics, and so on. The projection has an educational value because of its merits, the main one of which is simplicity.
MR. FRED. BROOKS (by letter).— Though Mr. Cahill's subject is the more widely important one of the map on a flat surface, he makes a reference to globes, consideration of which is a valuable addition to the discussion of maps, besides having much interest of its own. Mr. Cahill's passing reference may be supplemented by a few further observations. Though as Mr.
LAND MAP OF WORLD ON NEW PROJECTION. 207
Cahill says (page 170), not all of the surface
of a globe can be seen at once, a man who wished to see both sides
at once might have two globes side by side, as he has two maps, one
of each hemisphere, side by side in existing atlases; but as
the human mind is not well adapted to attend to more than one thing
at a time, this is an insignificant point. Half of the globe to
be looked at at once may be chosen so as to include nearly all the
land surface excepting Australia and the Antarctic continent; and
it is that hemisphere of land which Mr. Cahill especially wishes to show
rightly in the new map; so it is not in that point that the map has an
advantage over the globe.
Mr. Cahill (on page 172) refers to a scheme for a giant globe as projected, and (on page 176) he speaks of the possibility of putting sectional sheets together on a 42-ft. globe, and uses the phrase "if a millionth globe were actually constructed:" Why the "if"? Such a globe has actually been constructed. Being on a millionth scale, it had a circumference of 40 meters and a diameter of 12.73 meters, or about 42 ft. Topographical details were of course supplied independently of the newly formed international organization for gathering the material which Mr. Cahill mentions. It was "filled in from our present knowledge," to borrow his phrase (from page 176), but it was done under scientific auspices, and was done well for its purpose. The globe was a very interesting feature of the International Exposition at Paris in 1889. It was in a special building arranged with a spiral ramp so that visitors after having been taken to the top by an elevator could walk down going round and round the: globe and seeing the different parts of its surface. It was turned slowly around on its axis. The framework of the building as well as of the globe itself was put together so that they could be taken apart and if desired could be readily set up again in some other place. There were 586 panels making up the surface of the globe; they were of pasteboard on a frame of wood.
For temporary exhibition purposes I think this globe, "La Terre au Millionieme," superior to the very pleasing Millionth Relief Map, with real water, proposed by Mr. Cahill (on page 177) with reference to the 1915 Panama-Pacific International Exposition.
[NOTE. — Further discussion of this paper is invited, to be received by Fred Brooks, Secretary, 31 Milk Street, Boston, by November 15, 1913, for publication in a subsequent number of the JOURNAL.]
GK note: As mentioned previously, these are scans of the front and back cover of a pamphlet reprint of this article, from poor-quality Xeroxes; its title was longer than the original:
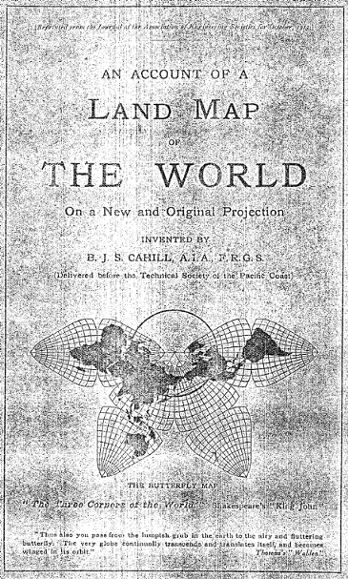
The epigraphs above are:
"The Three Corners of the World" Shakespeare's King John
"Thus also you pass from the lumpish grub in the earth to the airy and fluttering butterfly. The very globe continually transcends and translates itself, and becomes winged in its orbit." Thoreau's "Walden"